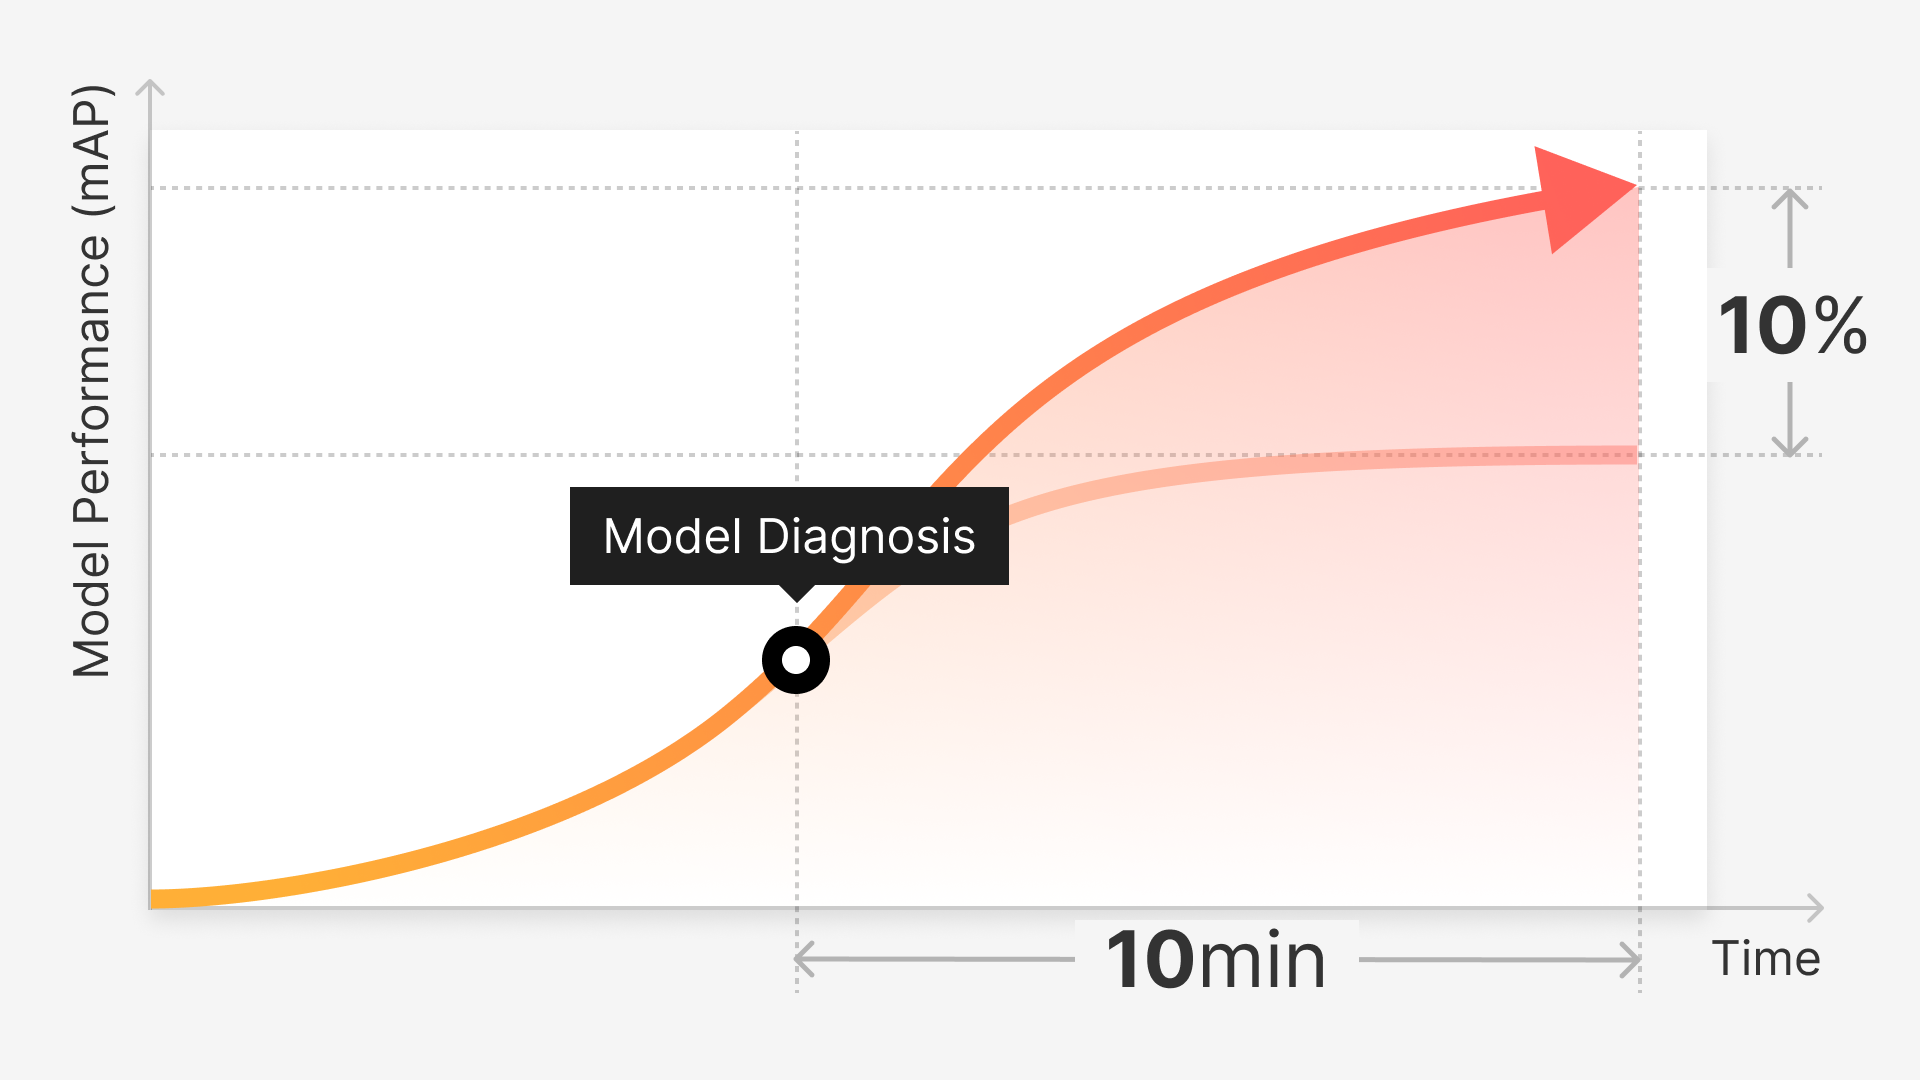
You are given a task to analyze and process hundreds of thousands of data points to select data for AI training.
As it turns out, this task is a lot more energy- and time-intensive than you'd initially anticipated. Specifically, the analysis of unstructured data comes with an overwhelming number of factors to contemplate. Sure, you could lean on metadata to simplify your work, but metadata alone falls short in dealing with the sheer diversity and complexity of unstructured data.
For instance, you may categorize your data based on when it was collected - daytime or nighttime - using the metadata that indicates the time of acquisition. However, given the complex nature of unstructured data, metadata alone can't fully capture its intricacies. Consequently, you'll find yourself setting more standards and conditions for data curation and categorization to fill the gaps that you didn’t anticipate before and revisiting the curation and categorization outputs over and over.
Yet, it's crucial to never downplay the importance of this iterative and meticulous process. Feeding a model with incorrect or superfluous training data can drastically undermine model performance. Inevitably, you'll have to circle back to data quality to address these performance issues. In this context, labeling data that doesn’t contribute to model training becomes a colossal waste of time and resources.
Given this, the most efficient way to build a robust model would be to analyze raw data, determine its value, sort out only the valuable ones, and label them first, while considering data quality, quantity, diversity, and the ultimate objectives of the model at each step.
With the help of Superb Curate in deciphering patterns and trends within raw data, you can swiftly curate and process only the meaningful data. Weeding out unnecessary data helps you conserve the human and material resources required for data processing. Presented here is a straightforward yet golden recipe (guidelines) you can follow on the Superb Platform for efficient and effective resource utilization.
Recipe Case 1.
Starting With the Minimum Quantity of Data for Training
(feat. How to cut labeling costs by more than 50%)
Recommended for:
Those who want to build a valuable dataset and train a model with minimum resource input
Those who want to analyze any biases in raw data before starting the labeling process
Setting Goals:
Understand the trends and patterns in available data, curate a set of data with the minimum bias, and label the dataset for AI training
[Recommended] Check out an interesting experiment of Superb Curate that achieved comparable performance with the comparison group with 75% fewer data
When the data consists of more than 10,000 images, curate 25% of the total
When the data consists of around 5,000 images, curate 40~60% of the total
When the data consists of around 1,000~2,000 images, curate all
Recommended Workflow Summary:
Upload large data to Superb Curate
Understand data trends and patterns with the Thumbnail & Scatter View features
Auto-curate what to label
Understand the trends and patterns in curated data with downloadable reports
Send curated data to Superb Label to start labeling
View Details of the Curate Workflow (drop-down menu)
1. Create a Dataset:
Click [Curate] located at the top left corner of the Superb Platform to view the home screen of Superb Curate.
2 . Upload the Dataset:
You need to upload a dataset.
Click [Create Dataset] to create a dataset and upload raw data. (Want to know how? )
Uploading image data via Superb Label
* If your data is not uploaded to Superb Label: Check here to see how you can upload dataYou can send the data uploaded in Superb Label to Superb Curate.Uploading image data via SDK
Use Superb Curate SDK to upload large amounts of image data conveniently. Install SDK to start.
Upload your data according to the instructions in the SDK Workflow document.
3. Use the Scatter View to Understand Data Trends:
Use the “Thumbnail View” in the Scatter View to quickly understand the distribution and trends of image data based on visual similarity. Images that are distant from the center of the distribution could represent Edge Cases (rare cases), and clusters with lower density indicate a fewer number of images.
This is a visualized distribution of the MNIST dataset. Data that share similar characteristics are grouped closely together, forming clusters. For example, you can observe that the images of “4” and “7,” which have similar shapes, are located near each other. You can also find patterns and types of edge cases (insufficient or low-quality data, etc.) by observing relatively sparse clusters.
Even with the Scatter View alone, you can quickly grasp various aspects of your data, enabling informed decisions on your next steps, such as which data to collect or feed more for your model training.
4. Auto-Curate What to Label
Click [Auto-Curate] at the middle right of the screen.
Click [Curate What to Label] in Auto-Curate.
Auto-Curate considers visual sparseness, balanced distribution, etc., of the raw data to curate what to label. These criteria help determine if the selected data appropriately represents the dataset and can be used to build an effective model.
You can adjust the amount of data you want to label in Auto-Curate. The optimal quantity of training data may vary by project due to various variables such as the number of labelers, project timeline, and the type of data and annotation. If it is hard to estimate the appropriate amount from the beginning, you can start with the recommended quantity below. Here, we are curating 17,500 images, which is 25% of the total.
[Recommendations] Decide how many data points to use for model training based on the amount of data you have:
When the data consists of more than 10,000 images, curate 25% of the total
When the data consists of around 5,000 images, curate 40~60% of the total
When the data consists of around 1,000~2,000 images, curate all
Once Auto-Curate is executed, a “slice” containing the curated data will be automatically generated. Name the slice for better management.
[Note] If you are unfamiliar with the term “slice” - Learn more about “Slice”
Once all steps are complete, click [Curate] to initiate Auto-Curate.
It took around 10 minutes for Auto-Curate to automatically select 17,500 images (25% of the total 70,000 images) that are the most valuable for model training.
5. [Advanced] Download a Report to Examine the Curated Dataset
Check a downloadable report to quantitatively assess the patterns and trends of the curated data. You can see how balanced the curated dataset is compared to a randomly selected dataset. Of course, both datasets have the same data quantity.
6. Start Labeling by Sending the Curated Data to Superb Label
Select the slice you created with Auto-Curate’s “What to Label.”
Click [Send to Label] located at the top of the Superb Curate screen.
Select a Superb Label project to which you want to send the images from Superb Curate. If you have many projects in Superb Label, you can search for the right project in the pop-up window.
[Note] If you want to send data to a new project, not an existing one, you need to first configure (data/annotation types, etc.) and create a new labeling project in Superb Label. Please note that you cannot create a new Superb Label project in Superb Curate.
Click [Label] located at the top left to move to Superb Label.
You can check the progress of the data upload in real-time with the progress bar at the top right of the screen.
Set up a project in Superb Label.
[Note] Haven’t tried project settings before? Learn more about project settings in the Projects Overview and Create Projects documents.
If you are sending data from Label to Curate, proceed with a new project, not an existing one, for better version management.


